One framework that collapses the distance between what a team wants and the trustworthy thing it should become — DOT IT: Develop with AiNa, Observe with SRE, Test with TestForge, on a sovereign smart Pod — and iterate.
Every team building with AI faces the same distance: the gap between intent — what a person actually wants — and content — the trustworthy thing that intent should become. A working pipeline. A verified answer. A shipped product, with its work shown. The tools on the market each cover a slice of that distance and leave the seams to the team. DOT IT closes it with one framework, on one machine a team owns.
The framework is a single sentence followed by a loop. The sentence is the operating principle of the whole system: collapse the distance from what a team wants to the trustworthy thing it should become. The loop is how you keep collapsing it as reality changes — you Develop, you Observe, you Test, and you iterate. DOT IT, then do it again.
Three named tools carry the three letters, and a fourth move — iteration — turns them from a pipeline into an organism. Each tool is real, in production today, and each runs on infrastructure the team controls.
And then IT — iterate. The output of Observe and Test becomes the next intent for Develop. A red metric, a failing dimension, a missing feature: each is a new request the loop absorbs. "IT" is also the work itself — the team's DevOps, made continuous. The four words name the whole motion: DOT IT.
Underneath the loop, the toolchain that closes the distance has four parts — the four C's: concepts (the principles and registries that keep the system honest), code (the cells and pipelines), compute (a foundry of local models on hardware the team owns), and collaboration (a shared Pod, a voice agent, a single pane of glass). Concepts, code, compute, collaboration — together they turn intent into content.
Three commitments bind everything below and make the content trustworthy, not merely produced:
Survey the tools a team could reach for and the market splits cleanly in two, with nothing in the middle. At one extreme sit local developer utilities — the on-device, open-weight runtimes — sovereign by design but with no audit trail, no compliance mapping, and no governance. At the other sit enterprise cloud platforms — strong on governance, but they route proprietary code and data through someone else's infrastructure and score near zero on data residency. No product bridges the divide, because enterprise governance has historically assumed a centralized backend, and local-first tools deliberately refuse one.
DOT IT lives in the gap that split leaves open: compliance-grade governance implemented entirely on the team's own machine. Audit receipts, consensus proofs, and PII gating are not bolted on after the fact from a cloud control plane — they are properties of a Pod the team owns. The chasm is structural, not incidental, which is exactly why closing it is worth a framework rather than a feature.
AiNa is the Develop pillar: a pipeline that takes a single request and produces a complete product package — a working codebase and the full document set behind it. Nine specialised persona clusters run in sequence, each consuming the prior's output: a Braindoc interview frames the problem; Intent sets scope; Ideation writes the PRD, data model, and API contract; Dev scaffolds, builds, and tests; Security threat-models and audits; Readiness assesses deploy, cost, and DR; Marketing writes the brand and landing copy; Docs assembles the manuals; Ops produces the runbooks and go-live checklist. Human-in-the-loop gates sit between the major stages.
The headline deliverable is the document set — every stage leaves a real, detailed markdown document. The code is one of the outputs; the thinking is the rest. A team walks away with the braindoc, the SOW, the PRD, the dev notes, the security review, the marketing pack, and the ops runbook — not just a repository.
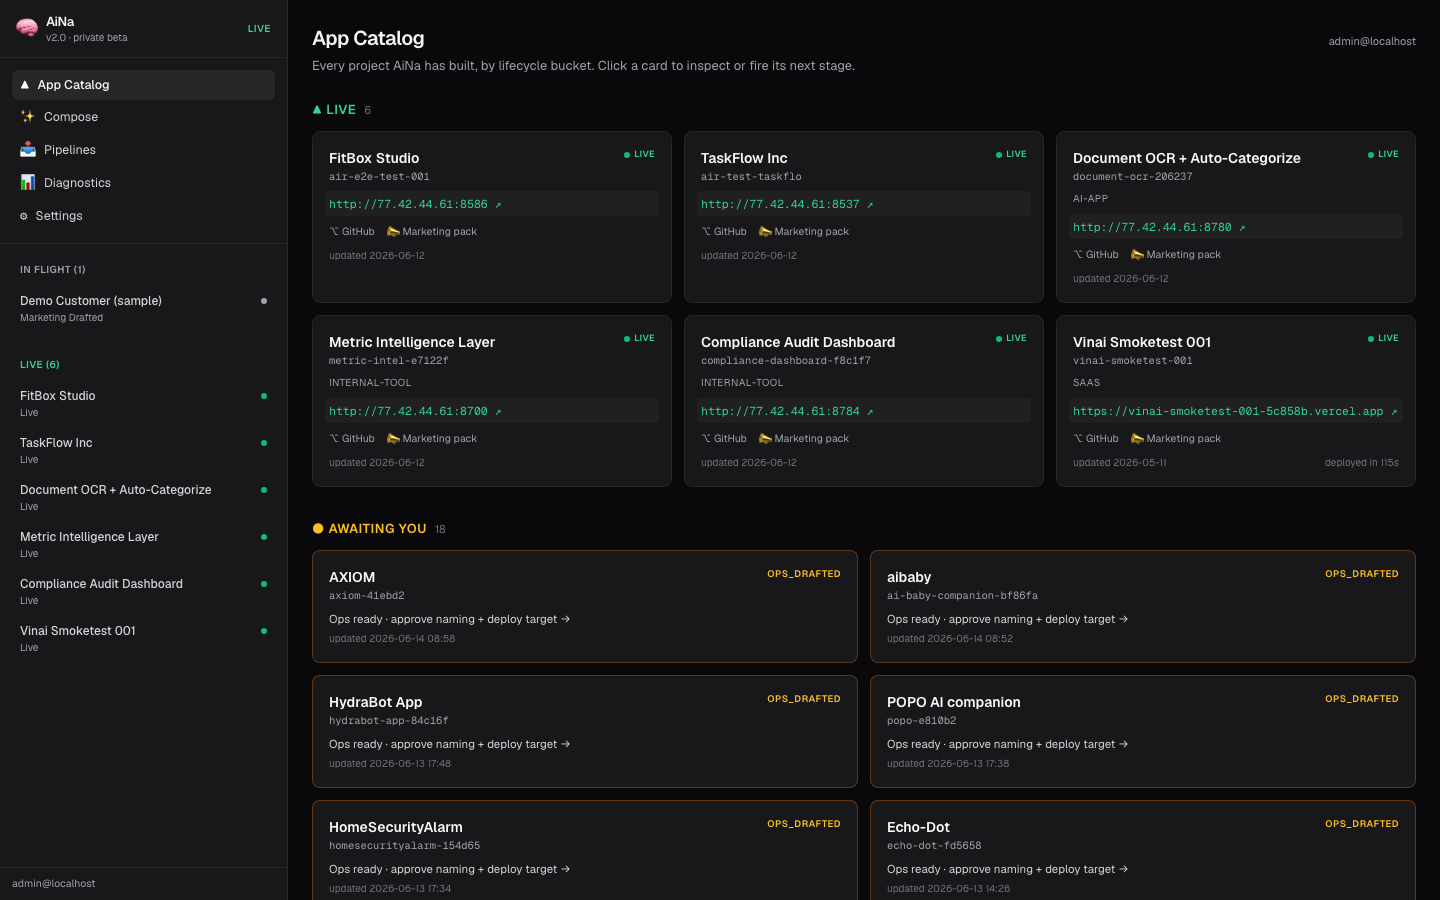
From one customer input, AiNa runs ten autonomous stages with four human-in-the-loop gates — and humans review pull requests, not chat threads. Every stage leaves a real document; the code is one output among many.
A privacy proxy redacts PII before any cloud-model call; tier-aware routing picks a lite / pro / enterprise model per stage; deploys auto-provision to the team's VPS or to Vercel with environment, domain, and tokens configured at deploy time. The runtime is MIT; the orchestrator is source-available.
Output never ships bland or broken, because AiNa does not freehand the foundation. A transparent classifier reads the request and routes it to one of two golden stacks, then seeds a known-good starter the personas extend:
The operator can pin the stack or let AiNa auto-decide; either way the right deploy target follows the stack. Each generated app becomes its own repository — assignable to a different team member to build further — in the org the team chooses.
Develop travels. The whole pipeline is also packaged as a one-line Claude Code skill, so any environment with a terminal can run it — and it runs on the installer's own Claude, with no server and no required API key.
Install with npx aina-skill@latest (or as a Claude Code plugin), describe what you want, approve each gate, and receive the document set plus a verified, runnable app — as a folder, a zip, or a pushed repository. OpenRouter is an optional accelerator; the default engine is the team's local Claude. It is the App Factory for everyone else, the same personas and golden stacks behind a single command.
aina-skill; the engine ships per-app repos to the team's chosen org, and verifies (runs and fixes) the generated app before declaring it done.Once intent has become a running system, something must watch it — and not merely raise alarms. The Observe pillar is an autonomous Site Reliability Engineer that moves from bug-hunter to operator: it sees deep, correlates statistically, triages without a human in the first loop, and resolves within graduated, auditable autonomy.
A Background Intelligence Engine gives it eBPF-based kernel observability — syscalls, network, scheduling — far below what dashboards surface, with statistical baselining and anomaly correlation that turns 960 daily alerts into a handful of real signals. The median SRE engineer spends 30% of their hours on repetitive toil and watches MTTR plateau near five hours; observation that only observes is the reason. This pillar exists to break that plateau.
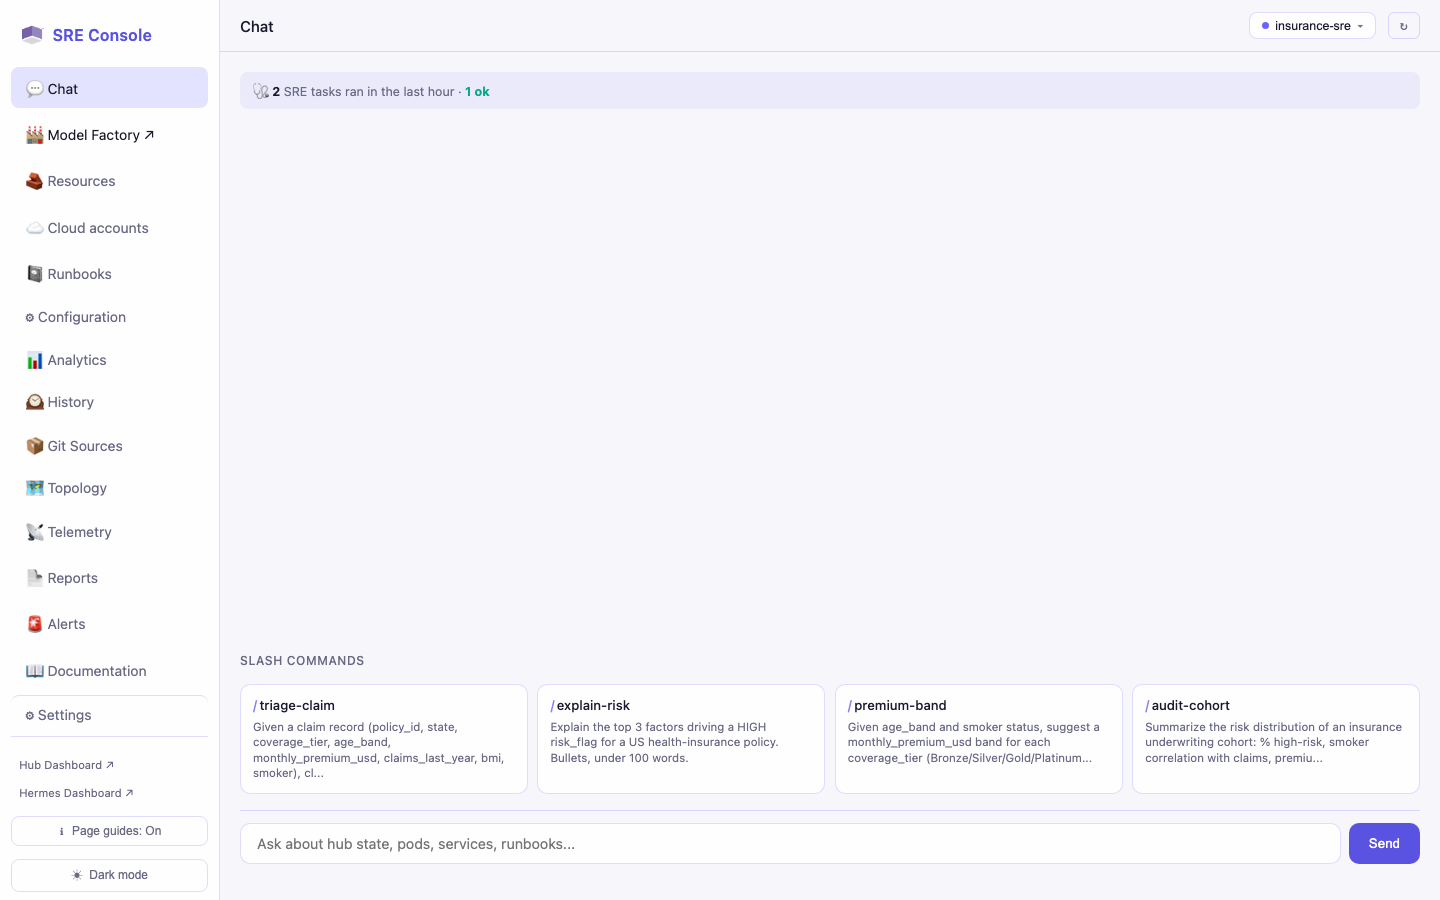
It is not three tools — it is one virtual Kubernetes engineer, split across three surfaces only to keep each uncluttered. You converse with it, it acts on its own, and it gets measurably better at your cluster over time.
The differentiator is the closed learning loop: most assistants are read-only or generic, but this one feeds its own operational record — history, audits, incidents, actions — back into training. The result is a specialist in the team's cluster, not a generic model, and it improves with every retrain. New behaviour hot-swaps behind a stable /v1 alias, so the surface URL never changes when the brain does.
When a real signal appears, an Interactive Troubleshooting Engine runs a multi-step autonomous triage: detect, gather evidence, hypothesise, rank causes, propose a remediation, and — within its granted autonomy — act, every step recorded. A Knowledge & Learning layer mines its own history for recurring patterns and proposes playbooks, so the system gets quieter over time rather than louder.
Autonomy is graduated: low-confidence findings advise, high-confidence-plus-low-blast-radius actions execute, and a composite confidence score gates the boundary. Every state-changing operation is logged for pattern mining and audit — the same trail that makes compliance a byproduct rather than a project.
On the Pod, Observe is wired in read-only through the mirror (Part V): the SRE surface watches the team's running apps and the Pod itself without the authority to mutate them out-of-band. Observation and action stay separate and one-way — the system can see everything and change only what it is explicitly licensed to, with a receipt for each change.
Develop produces; Observe watches; Test decides whether to trust. TestForge is the verification pillar — a polyglot analyzer (JavaScript/TypeScript, Python, and Go, natively) that scores a codebase across twenty-two dimensions and, crucially, runs the thing rather than only reading it.
The dimensions span the real surface of risk: correctness and edge-cases, security (intra-procedural taint on FastAPI/Flask via a Python AST pass), live supply-chain auditing against OSV.dev, real coverage parsed from lcov/Cobertura/Istanbul and pytest, contract conformance, accessibility scored on density rather than raw volume, dead-code traced through runtime dependencies only, a Kubernetes dimension that parses manifests and Helm, and a size-independent predictive hotspot score. Scoring is principled — diminishing-returns, monotonic, severity-weighted, floored, with zero reserved for the genuinely catastrophic — so a large repo never floors to 10 and a platform with only minor gaps never reads 0/100. No cliffs; no cry-wolf.
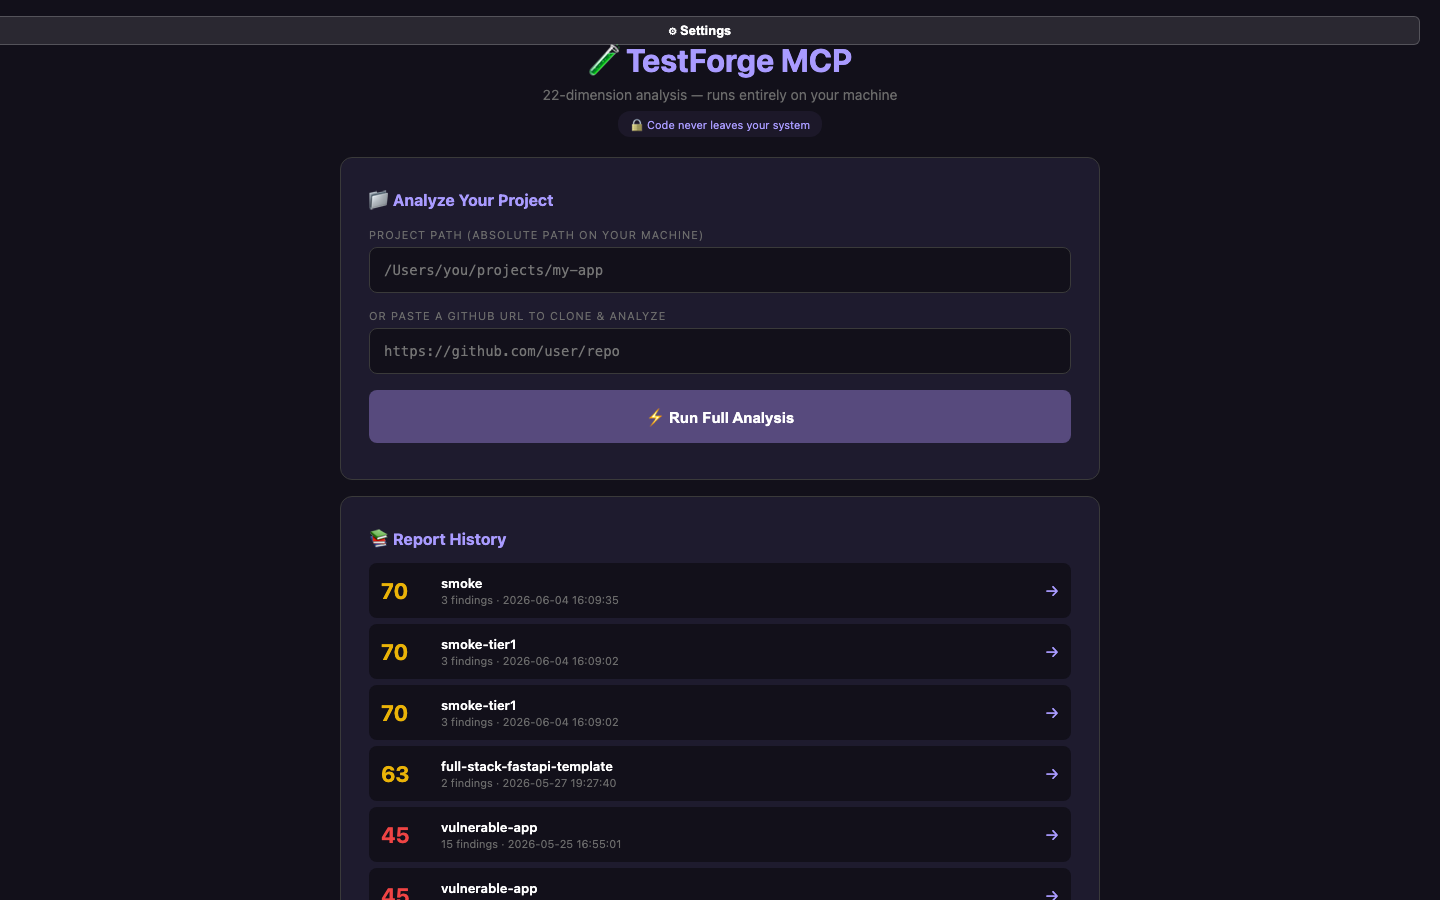
Static analysis is necessary and insufficient. TestForge's simulation engine boots the application in a hardened sandbox and exercises it for real: a load ramp (with a discarded warm-up window so cold starts don't read as failures), chaos (inject a crash or freeze under load, then measure error rate and recovery time), agent-load (a fleet of concurrent clients with think-time), and compose-aware runs that stand up a whole web+db+cache stack. The runners are capability-locked — dropped privileges, no network, memory/CPU/PID limits — and gated behind a bearer secret.
The product is tiered so a team can start free and grow: an open-source core, a Pro tier, a Team tier, and Enterprise — with the heavier sandboxed runs available as a managed service behind a docker-socket-proxy that exposes only what the analyzer needs. On the Pod, TestForge wires in read-only through the mirror alongside SRE.
The Test pillar shares its philosophy with the Pod's trust layer: a single judge — human or model — has blind spots that line up with its own. So trust is never asserted; it is earned by survival. A finding that survives the analyzers, the simulations, and (where it matters) an adversarial multi-model verdict is one a team can act on. Everything else is flagged, not shipped.
DOT IT runs somewhere, and where it runs is the point. The intended deployment is a Pod: one 128 GB machine per team of roughly five analysts and AI engineers, who work from lightweight 16 GB satellite laptops over Tailscale — developing, observing, testing, and iterating their pipelines with AiNa, SRE, and TestForge. The heavy compute, the models, fine-tuning, consensus, and memory live on the Pod; the laptops just look into the mirror.
The organising idea is one brain, many instruments. Claude (via the team's local subscription — no API key) is the only top-level intelligence; every local model, agent, and harness is a tool it calls, never a peer. The machine grows like tissue: each new ability is a new self-contained cell, born with its own genome (what it IS, OWNS, DEPENDS on, must NEVER do, and how to VERIFY it). Capability arrives by addition, not by rebuild.
The first real Pod is two machines, and it shows the pattern in miniature:
The Pod holds far more models than fit in memory at once, so a single gateway — Switchboard — governs a fleet: pinned backends stay always-on (the hot model, voice, embeddings), while fleet backends load on first request and evict least-recently-used under a fixed memory budget. Adding a model is a config block and a registry row; the discipline lives in the routing table, not in code. A fine-tune is just another fleet model; a vision model is just another fleet model. A deep, adversarially-verified survey picked the best open-weight model that actually runs on Apple Silicon per task — the sweet spot being a ~30B mixture-of-experts — with frontier reasoning reserved for Claude.
Trust by consensus is enforced here. Unless a task is a deterministic routine, any finding runs through a council: a heterogeneous bench of two-to-three different-family models, reconciled by an adjudicator. Hallucinations are largely uncorrelated across model families, so diversity beats precision — three small models from different lineages filter error better than one large one. The arbiter sorts claims into agreed (reliable), disputed (uncertain), and single-asserted (likely hallucination, flagged). It is the same principle the Test pillar lives by: trust what survives the vote.
A single pane of glass makes the whole organism legible: the Command Center is the frame between the team (and its voice agent, Aria) and every capability — each lit green only when its backend is live, with a running feed of receipts. It is the team's mirror: the reflective surface that reflects the Pod's state. Looking at one screen and trusting it is the central idea of how the machine evolves. SRE and TestForge both wire into the Pod read-only through this mirror.
The cloud is reachable, but only on the Pod's terms: one egress through the gateway's remote-provider route, a PII gate that tokenizes sensitive data before any hop and restores it in the reply, Claude served by the local subscription (never re-billed via a cloud provider), and the local path as the default. Reachable, not leaky.
Enterprises building with AI have been handed a binary choice. Adopt cloud coding tools and accelerate — but route proprietary source through third-party infrastructure, inheriting cross-border-transfer risk and the audit questions that follow. Or restrict teams to local tools that keep data on-device but offer zero audit trail, no compliance mapping, and no governance. CISOs and CTOs have been forced to choose between velocity and governance.
That choice is architecturally unnecessary. DOT IT runs on a Pod the team owns: on-device inference for velocity, plus audit receipts, consensus proofs, and a PII-gated single egress for governance — at the same time, on the same machine. Velocity and governance, not one bought with the other.
DOT IT treats compliance as something the architecture is, not a certificate bought after the fact. Because the Pod records every state-changing operation — every inference, generation, deploy, and remediation — and gates every cloud hop through one PII chokepoint, the evidence an auditor needs is a byproduct of normal operation rather than a separate project. Each pillar already emits the trail: AiNa's PR-based gates and per-stage documents, SRE's logged operations and graduated-autonomy receipts, TestForge's scored, reproducible reports.
| Regime | What the sovereign Pod provides |
|---|---|
| SOC 2 | Append-only, tamper-evident audit logging of security-relevant operations; each artifact mappable to a control. |
| HIPAA | Encryption at rest and in transit, on-device key handling, and audit controls over every access to sensitive data. |
| GDPR (Art. 25 / 44) | Data protection by design — PII detected and tokenized before any hop; no plaintext crosses a border because nothing leaves by default. |
| EU AI Act (Art. 12) | Automatic recording of model decisions — prompt, model, parameters, retrieved context, and output — for forensic reconstruction. |
Procurement of AI tooling has moved from a developer-productivity decision to a governance, risk, and compliance one. DOT IT's primary value driver is therefore not raw speed — it is that the trustworthy thing intent becomes arrives with its compliance evidence already attached, on hardware the enterprise controls.
The cost structure follows the thesis. The hardware to stand up a Pod is a rounding error against the cost of the people who run it; tooling is cheaper still. What an enterprise is really buying is the elimination of weeks of manual evidence collection and the removal of a class of data-residency risk — value that compounds every time the loop runs.
DOT IT is a loop, not a line. The output of Observe (a flap, a regression) and Test (a failing dimension, a survived bug) becomes the next intent for Develop. The team does not start over; it iterates on tissue that already exists. On the Pod, that loop is even made literal: a recursive fine-tuning companion generates a domain dataset, verifies every training row through multi-model consensus, fine-tunes, benchmarks, finds the gaps, and repeats until it converges — the same Intent→Content motion run as one self-improving cycle, now open source.
If the Pod is the machine, the first product is what it serves: AI-Native Analytics, a unified analytics application built on the Pod for a ~5-analyst team. It is the thesis made concrete — intent (a question, an alert) becomes content (a verified answer with its work shown), through the four C's, on one team's machine. The stance is additive: give analysts an instrument they choose to adopt, with trust coming from the two principles that already run the foundry — consensus (never a single inference) and receipts (every action shows its work, flags its uncertainty, and is human-overridable).
It is one application with two role-based surfaces over shared, frontend-agnostic backends: a customer chat surface and an engineer/ops surface. The model tier stays native on the host; the Pod control-plane runs under a process manager; the product's eight capability backends and both frontends ship on k3s via a single Helm chart, identical per Pod. SRE and TestForge wire in read-only through the mirror — Observe and Test, watching the thing Develop built.
Adopting DOT IT is itself an iteration, not a big-bang install. A team stands the loop up in vertically integrated increments, each one usable on its own, sequenced so the trust keystone — the PII gate and audit trail — is proven before any cloud-bound routing is enabled.
The loop is already live and demo-ready. We prove the whole motion end-to-end on our own infrastructure first — running on synthetic data, or on your data with PII redacted and anonymized on-device — so that by the time it reaches you, every pillar is functional and every action already carries a receipt. Turning that proven demo into your production deployment is a short, guided sequence, and we are beside you for all of it.
Delivery is not a leap of faith at the end — it is the architecture working the way it was built to. Because we prove the demo functions end-to-end on our own infrastructure first, on synthetic or PII-redacted data with every pillar exercised, the system arrives already verified. What remains is a supported transition, not a fresh build.
DOT IT is one framework for the whole motion: Develop with AiNa, Observe with SRE, Test with TestForge — on a sovereign smart Pod a team owns — and iterate. It collapses the distance from what a team wants to the trustworthy thing it should become, through concepts, code, compute, and collaboration, with one brain orchestrating and consensus proving. Look into the mirror; trust what survives. Intent → Content. DOT IT.